

SSC CGL Quant – Data Interpretation – Level 1 · Warm-up · Tier I Level
← Back
72 ÷ 3.6 = 20%.
₹399 →
SSC CGL Quant – Data Interpretation – Level 1 · Warm-up · Tier I Level – 12 questions, subject: Quantitative Aptitude. Every question has the correct answer with a one-line explanation; tap "Show Answer". Free practice for TNPSC, UPSC, SSC, Bank and RRB exams – Shanmugam IAS Academy, Coimbatore.
Get daily current affairs & exam alerts – follow us
YouTube
WhatsApp Channel
Telegram Channel
Facebook Page
Instagram
Share with friends & study groups
Link to this page from your website / blog (HTML code)
1.
Data tableWhat was the total enrolment in 2024?
Directions (Q 1–5): The table shows the number of students enrolled in five courses at a coaching centre (fictional data).
| Course | 2022 | 2023 | 2024 | 2025 |
|---|---|---|---|---|
| SSC | 240 | 260 | 300 | 330 |
| Banking | 180 | 200 | 210 | 240 |
| Railways | 150 | 165 | 180 | 198 |
| TNPSC | 120 | 150 | 160 | 200 |
| UPSC | 60 | 75 | 90 | 72 |
Correct Answer: B [940]
Explanation:
300 + 210 + 180 + 160 + 90 = 940.
2.
(Use the directions above – Q 1–5)
Data tableBy what percentage did SSC enrolment increase from 2022 to 2025?
Data tableBy what percentage did SSC enrolment increase from 2022 to 2025?
Correct Answer: D [37.5%]
Explanation:
(330 − 240)/240 × 100 = 90/240 = 37.5%.
3.
(Use the directions above – Q 1–5)
Data tableWhat is the average Banking enrolment over the four years?
Data tableWhat is the average Banking enrolment over the four years?
Correct Answer: A [207.5]
Explanation:
(180 + 200 + 210 + 240)/4 = 830/4 = 207.5.
4.
(Use the directions above – Q 1–5)
Data tableWhat is the ratio of TNPSC enrolment to UPSC enrolment in 2023?
Data tableWhat is the ratio of TNPSC enrolment to UPSC enrolment in 2023?
Correct Answer: C [2 : 1]
Explanation:
150 : 75 = 2 : 1.
5.
(Use the directions above – Q 1–5)
Data tableWhich course had the highest percentage increase from 2024 to 2025?
Data tableWhich course had the highest percentage increase from 2024 to 2025?
Correct Answer: B [TNPSC]
Explanation:
SSC 10%, Banking 14.3%, Railways 10%, TNPSC 25%, UPSC −20%.
6. Bar chartIn which month did Dealer B's sales exceed Dealer A's by the largest number of units?
Directions (Q 6–10): The bar chart shows the two-wheeler sales (units) of two dealers in five months (fictional data).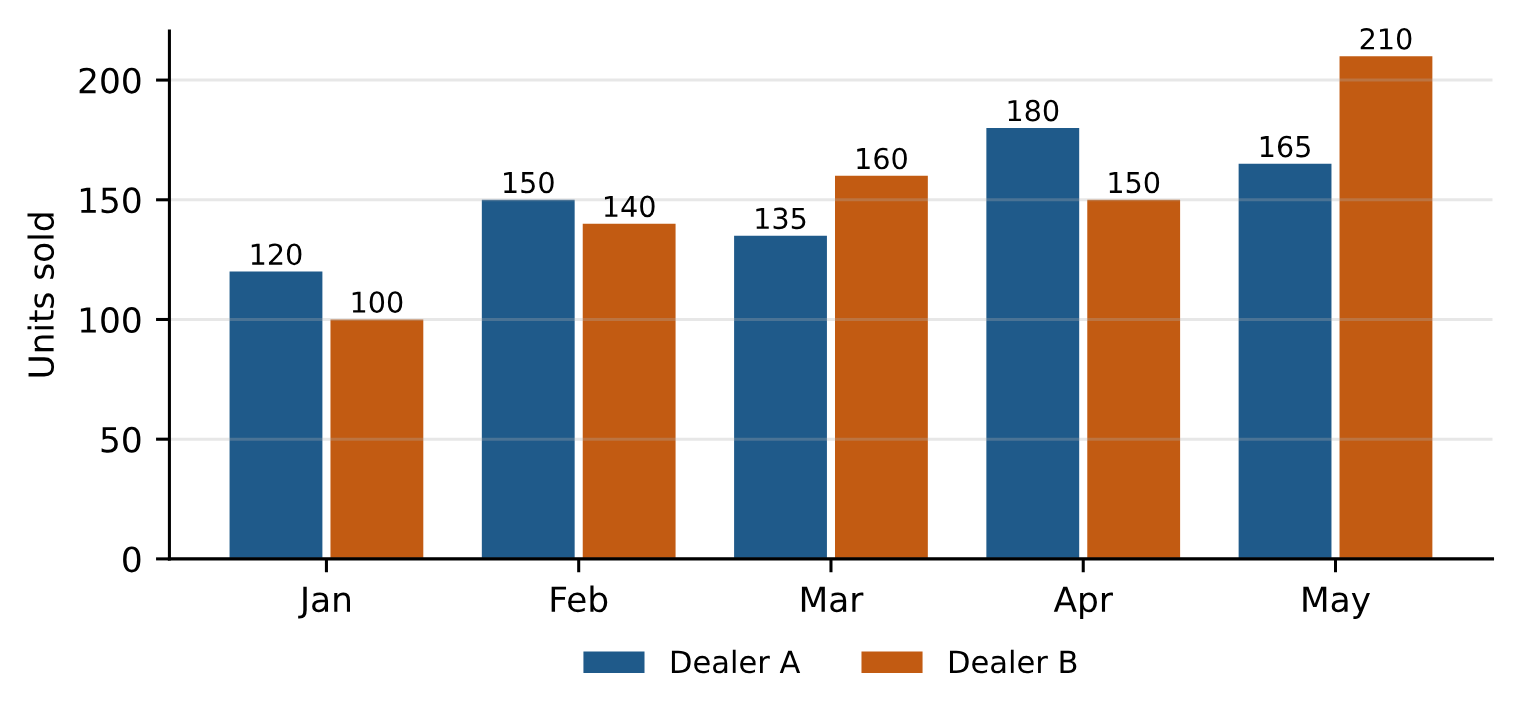
Correct Answer: A [May]
Explanation:
B − A: Jan −20, Feb −10, Mar +25, Apr −30, May +45.
7.
(Use the directions above – Q 6–10)
Bar chartWhat were Dealer A's total sales in the five months?
Bar chartWhat were Dealer A's total sales in the five months?
Correct Answer: D [750]
Explanation:
120 + 150 + 135 + 180 + 165 = 750.
8.
(Use the directions above – Q 6–10)
Bar chartWhat is the ratio of A's sales to B's sales in March?
Bar chartWhat is the ratio of A's sales to B's sales in March?
Correct Answer: C [27 : 32]
Explanation:
135 : 160 = 27 : 32.
9.
(Use the directions above – Q 6–10)
Bar chartBy what percentage did Dealer B's sales rise from January to May?
Bar chartBy what percentage did Dealer B's sales rise from January to May?
Correct Answer: B [110%]
Explanation:
(210 − 100)/100 × 100 = 110%.
10.
(Use the directions above – Q 6–10)
Bar chartIn how many months did Dealer A sell more than Dealer B?
Bar chartIn how many months did Dealer A sell more than Dealer B?
Correct Answer: A [3]
Explanation:
January, February and April.
11.
A pie chart shows a 25% share. What is its central angle?
Correct Answer: D [90°]
Explanation:
25 × 3.6° = 90°.
12.
In a pie chart a sector has a central angle of 72°. What percentage of the total does it show?
Correct Answer: C [20%]
Explanation:
72 ÷ 3.6 = 20%.
➤ Full notes, shortcuts and every answer explained – SSC CGL 2026 Quantitative Aptitude book (₹149): www.shanmugamiasacademy.in/study-materials/ssc-cgl-quantitative-aptitude
📘 TNPSC திறனறிவும் மனக்கணக்கு நுண்ணறிவும் (Aptitude & Mental Ability) – முழுமையான பாடநூல்
Here you get the answer with a one-line explanation. TNPSC திறனறிவு & காரணவியல் சிலபஸ் முழுவதும் · 14 அத்தியாயங்கள் + 2 அலகு மாதிரித் தேர்வுகள் · 357 பயிற்சி வினாக்கள் படிப்படியான தீர்வுடன் · மாதிரித் தாள்கள் (50 வினாக்கள்) · 14 மனவரைபடங்கள் · சூத்திரச் சுருக்கம், கணக்கு அட்டவணைகள்
Get the book – ₹199 More quizzes
› SSC CGL Quant – Mock Test M3 – Tier II Mathematical Abilities – Mock M3 · Tier II · Mathematical Abilities
› SSC CGL Quant – Mock Test M2 – Tier I Quantitative Aptitude – Mock M2 · Tier I · Quantitative Aptitude
› SSC CGL Quant – Mock Test M1 – Tier I Quantitative Aptitude – Mock M1 · Tier I · Quantitative Aptitude
› SSC CGL Quant – Speed Rounds – Tier II Level · Speed Round 5 · Marathon
› SSC CGL Quant – Speed Rounds – Tier II Level · Speed Round 4 · Marathon
› SSC CGL Quant – Speed Rounds – Level 3 · Speed Round 3 · Tier I Challenge
Score: 0
Answered: 0 / 0
