

SSC CGL Quant – Data Interpretation – Level 2 · Exam Level · Tier I Sprint
SSC CGL Quant – Data Interpretation – Level 2 · Exam Level · Tier I Sprint – 15 questions, subject: Quantitative Aptitude. Every question has the correct answer with a one-line explanation; tap "Show Answer". Free practice for TNPSC, UPSC, SSC, Bank and RRB exams – Shanmugam IAS Academy, Coimbatore.
Link to this page from your website / blog (HTML code)
Directions (Q 13–17): The pie chart shows how a family spends its monthly income of ₹ 60,000 (fictional data).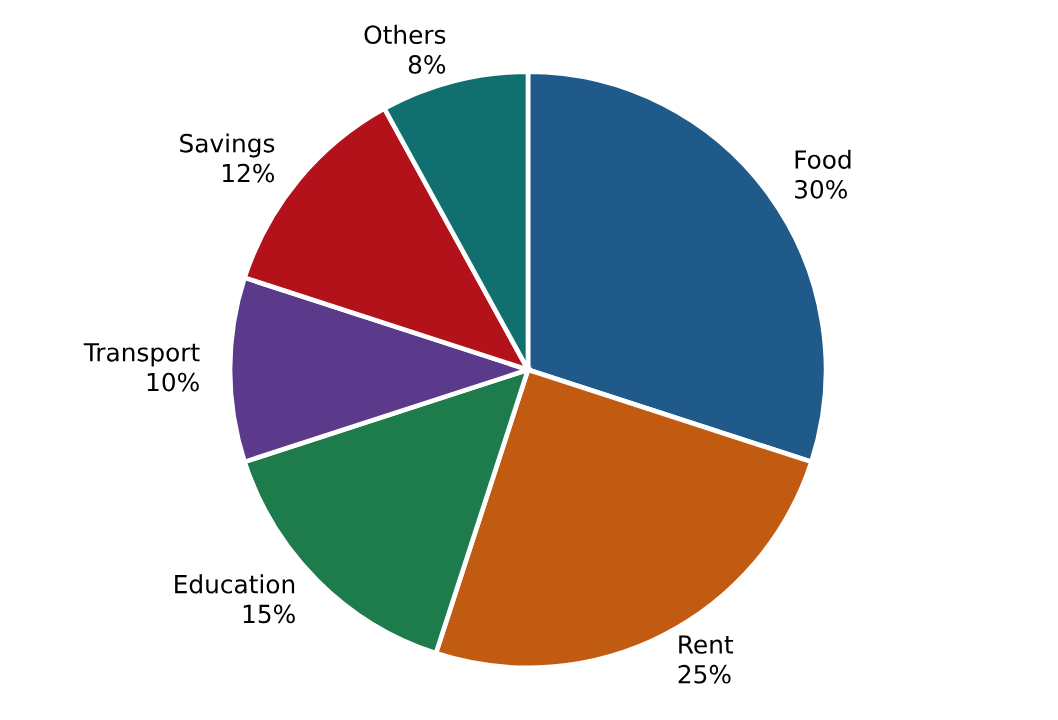
Correct Answer: A [54°]
Explanation:
15 × 3.6° = 54°.
Pie chartHow much does the family spend on Rent?
Correct Answer: B [₹ 15,000]
Explanation:
25% of 60,000 = 15,000.
Pie chartBy how much does spending on Food exceed spending on Transport?
Correct Answer: C [₹ 12,000]
Explanation:
(30 − 10)% of 60,000 = 12,000.
Pie chartWhat is the ratio of Savings to Others?
Correct Answer: D [3 : 2]
Explanation:
12 : 8 = 3 : 2 (angles are in the same ratio).
Pie chartIf the income rises by 10% and the percentage shares stay the same, how much will be spent on Education?
Correct Answer: D [₹ 9,900]
Explanation:
15% of 66,000 = 9,900.
Directions (Q 18–22): The line graph shows the annual profit of a company in ₹ lakh (fictional data).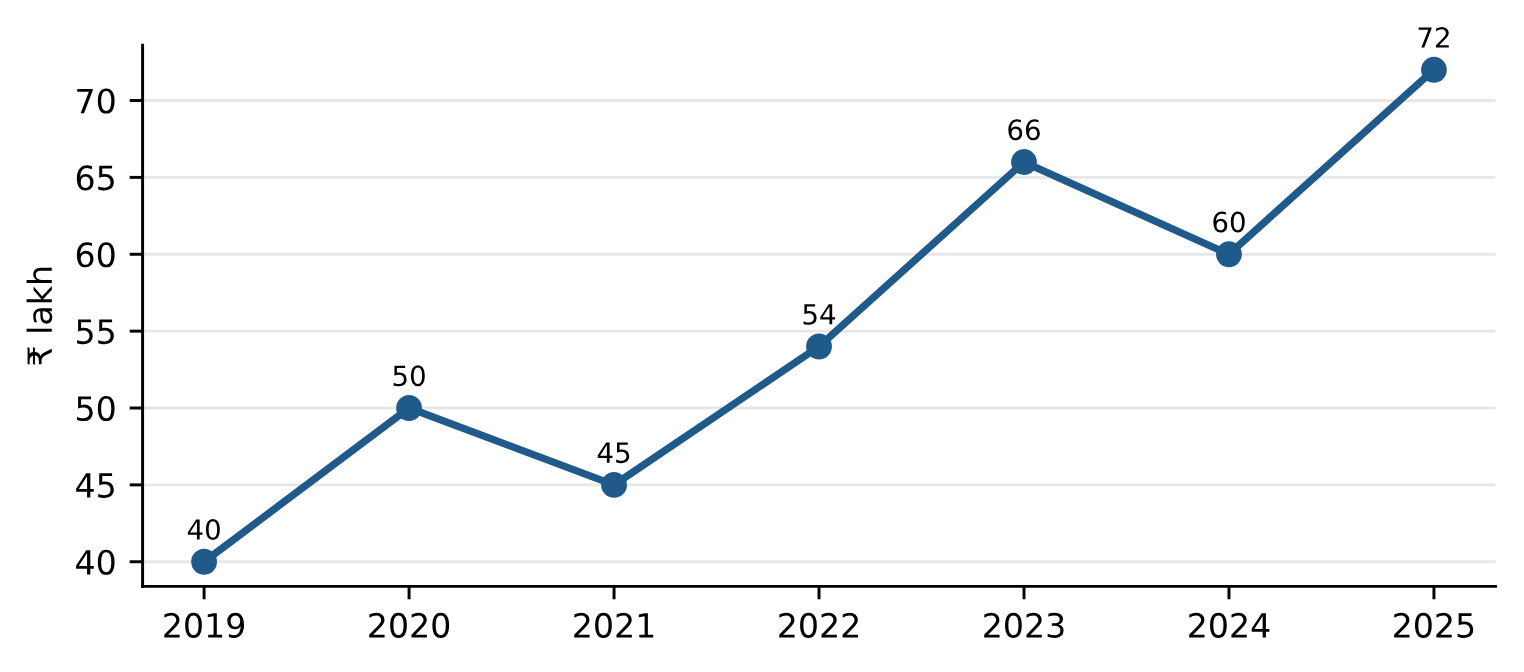
Correct Answer: A [2020]
Explanation:
2020: 25%, 2022: 20%, 2023: 22.2%, 2025: 20%.
Line graphIn how many years did the profit fall compared with the previous year?
Correct Answer: C [2]
Explanation:
2021 (50 → 45) and 2024 (66 → 60).
Line graphWhat was the average profit from 2021 to 2025?
Correct Answer: B [₹ 59.4 lakh]
Explanation:
(45 + 54 + 66 + 60 + 72)/5 = 297/5 = 59.4.
Line graphBy what percentage did the profit grow from 2019 to 2025?
Correct Answer: C [80%]
Explanation:
(72 − 40)/40 × 100 = 80%.
Line graphWhat is the ratio of the profit in 2022 to that in 2024?
Correct Answer: A [9 : 10]
Explanation:
54 : 60 = 9 : 10.
Directions (Q 23–27): A school has 1,200 students in five houses. The pie chart gives each house's share of the students and the table gives the percentage of girls in each house (fictional data).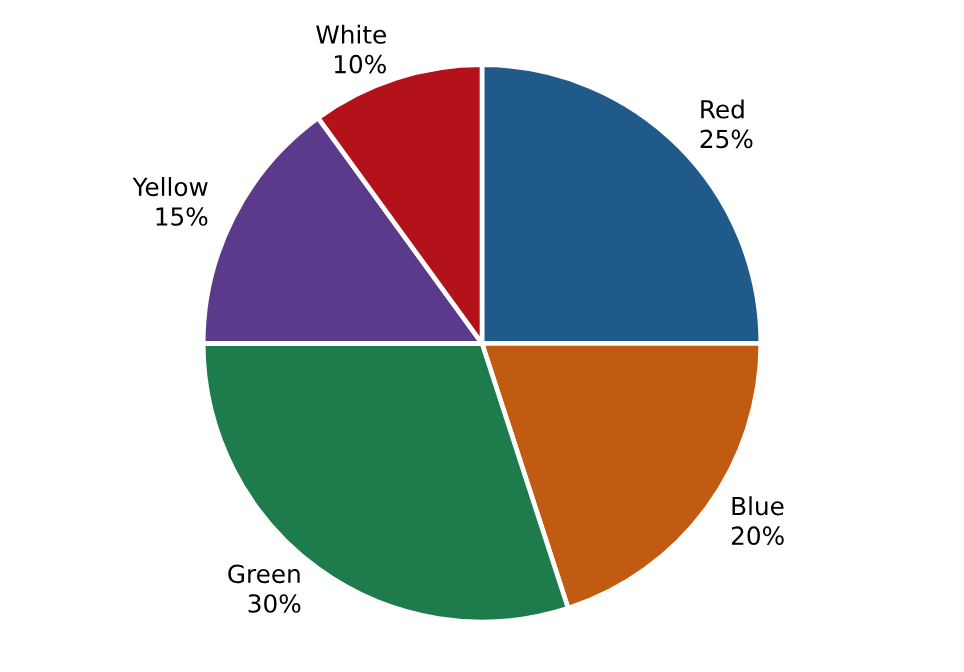
| House | Red | Blue | Green | Yellow | White |
|---|---|---|---|---|---|
| Girls (% of the house) | 40% | 50% | 45% | 60% | 35% |
Correct Answer: D [162]
Explanation:
30% of 1,200 = 360; 45% of 360 = 162.
Mixed DIHow many boys are there in Red and Blue houses together?
Correct Answer: B [300]
Explanation:
Red: 300 × 60% = 180; Blue: 240 × 50% = 120; total 300.
Mixed DIWhich house has the largest number of girls?
Correct Answer: A [Green]
Explanation:
Red 120, Blue 120, Green 162, Yellow 108, White 42.
Mixed DIWhat is the ratio of girls in Red house to girls in Yellow house?
Correct Answer: D [10 : 9]
Explanation:
120 : 108 = 10 : 9.
Mixed DIGirls form what percentage of all the students in the school?
