

SSC CGL Quant – Data Interpretation – Level 2 · Exam Level · Revision Round
← Back
Accounts = 36/360 = 10% → 10% of 2400 = 240.
₹399 →
SSC CGL Quant – Data Interpretation – Level 2 · Exam Level · Revision Round – 12 questions, subject: Quantitative Aptitude. Every question has the correct answer with a one-line explanation; tap "Show Answer". Free practice for TNPSC, UPSC, SSC, Bank and RRB exams – Shanmugam IAS Academy, Coimbatore.
Get daily current affairs & exam alerts – follow us
YouTube
WhatsApp Channel
Telegram Channel
Facebook Page
Instagram
Share with friends & study groups
Link to this page from your website / blog (HTML code)
1. Line graphIn which year were the combined admissions of the two schools the highest?
Directions (Q 36–41): The line graph shows the admissions in two schools X and Y from 2021 to 2025 (fictional data).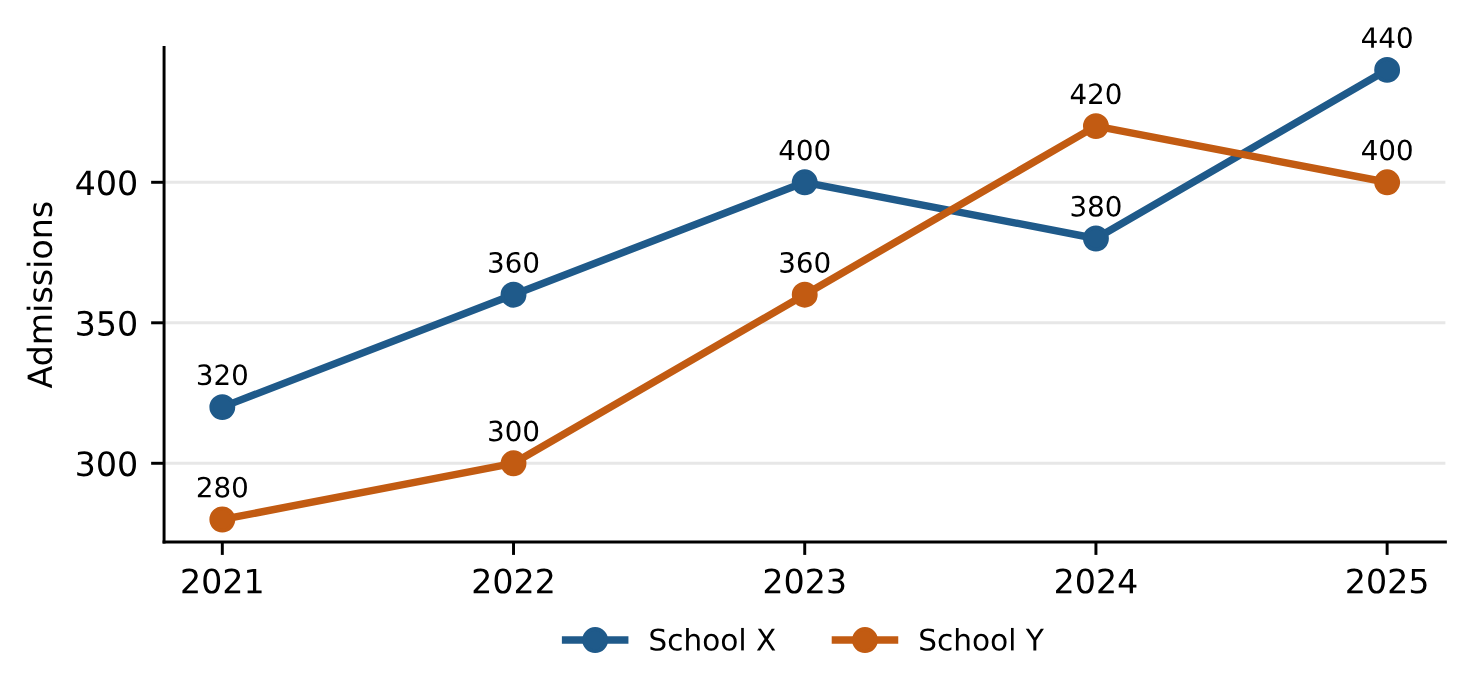
Correct Answer: C [2025]
Explanation:
Totals: 600, 660, 760, 800, 840 → 2025.
2.
(Use the directions above – Q 36–41)
Line graphIn how many of the five years did School Y admit more students than School X?
Line graphIn how many of the five years did School Y admit more students than School X?
Correct Answer: A [1]
Explanation:
Only in 2024 (420 > 380).
3.
(Use the directions above – Q 36–41)
Line graphBy what percentage did School X's admissions grow from 2021 to 2025?
Line graphBy what percentage did School X's admissions grow from 2021 to 2025?
Correct Answer: D [37.5%]
Explanation:
(440 − 320)/320 × 100 = 120/320 = 37.5%.
4.
(Use the directions above – Q 36–41)
Line graphWhat was School Y's average yearly admission over the five years?
Line graphWhat was School Y's average yearly admission over the five years?
Correct Answer: B [352]
Explanation:
(280 + 300 + 360 + 420 + 400)/5 = 1760/5 = 352.
5.
(Use the directions above – Q 36–41)
Line graphWhat is the ratio of School X's total admissions to School Y's total admissions over the five years?
Line graphWhat is the ratio of School X's total admissions to School Y's total admissions over the five years?
Correct Answer: C [95 : 88]
Explanation:
1900 : 1760 = 95 : 88.
6.
(Use the directions above – Q 36–41)
Line graphIn 2023, School Y's admissions were what percentage of School X's admissions?
Line graphIn 2023, School Y's admissions were what percentage of School X's admissions?
Correct Answer: C [90%]
Explanation:
360/400 × 100 = 90% (Y is the part, X the base).
7. Pie chartHow many employees work in Production?
Directions (Q 42–47): The pie chart shows how the 1,800 employees of a company are spread over five departments; the angles are in degrees (fictional data).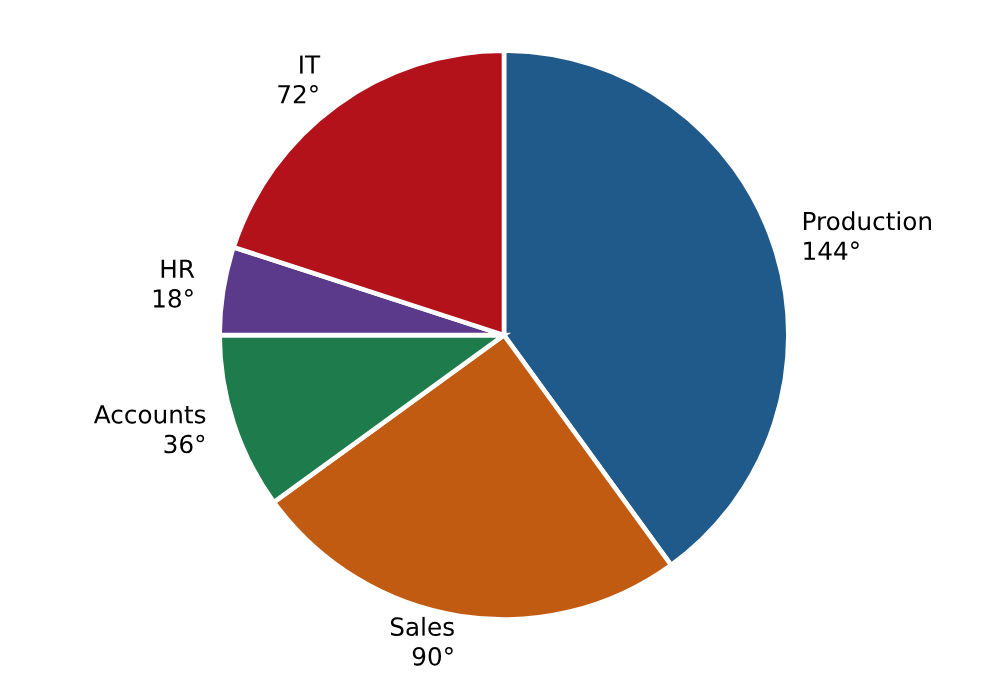
Correct Answer: B [720]
Explanation:
144/360 × 1800 = 720 (or 144 × 5, since 1° = 5 employees).
8.
(Use the directions above – Q 42–47)
Pie chartWhat percentage of all employees work in Sales?
Pie chartWhat percentage of all employees work in Sales?
Correct Answer: D [25%]
Explanation:
90 ÷ 3.6 = 25%.
9.
(Use the directions above – Q 42–47)
Pie chartBy how many employees does IT exceed HR?
Pie chartBy how many employees does IT exceed HR?
Correct Answer: A [270]
Explanation:
(72 − 18) × 5 = 54 × 5 = 270.
10.
(Use the directions above – Q 42–47)
Pie chartWhat is the ratio of Accounts staff to IT staff?
Pie chartWhat is the ratio of Accounts staff to IT staff?
Correct Answer: A [1 : 2]
Explanation:
36 : 72 = 1 : 2 (the ratio of the angles).
11.
(Use the directions above – Q 42–47)
Pie chartIf 10% of the Production staff are moved to Sales, how many employees will Sales have?
Pie chartIf 10% of the Production staff are moved to Sales, how many employees will Sales have?
Correct Answer: D [522]
Explanation:
Sales 90 × 5 = 450; 10% of 720 = 72 → 450 + 72 = 522.
12.
(Use the directions above – Q 42–47)
Pie chartIf the company grows to 2,400 employees with the same shares, how many will work in Accounts?
Pie chartIf the company grows to 2,400 employees with the same shares, how many will work in Accounts?
Correct Answer: B [240]
Explanation:
Accounts = 36/360 = 10% → 10% of 2400 = 240.
➤ Full notes, shortcuts and every answer explained – SSC CGL 2026 Quantitative Aptitude book (₹149): www.shanmugamiasacademy.in/study-materials/ssc-cgl-quantitative-aptitude
📘 TNPSC திறனறிவும் மனக்கணக்கு நுண்ணறிவும் (Aptitude & Mental Ability) – முழுமையான பாடநூல்
Here you get the answer with a one-line explanation. TNPSC திறனறிவு & காரணவியல் சிலபஸ் முழுவதும் · 14 அத்தியாயங்கள் + 2 அலகு மாதிரித் தேர்வுகள் · 357 பயிற்சி வினாக்கள் படிப்படியான தீர்வுடன் · மாதிரித் தாள்கள் (50 வினாக்கள்) · 14 மனவரைபடங்கள் · சூத்திரச் சுருக்கம், கணக்கு அட்டவணைகள்
Get the book – ₹199 More quizzes
› SSC CGL Quant – Mock Test M3 – Tier II Mathematical Abilities – Mock M3 · Tier II · Mathematical Abilities
› SSC CGL Quant – Mock Test M2 – Tier I Quantitative Aptitude – Mock M2 · Tier I · Quantitative Aptitude
› SSC CGL Quant – Mock Test M1 – Tier I Quantitative Aptitude – Mock M1 · Tier I · Quantitative Aptitude
› SSC CGL Quant – Speed Rounds – Tier II Level · Speed Round 5 · Marathon
› SSC CGL Quant – Speed Rounds – Tier II Level · Speed Round 4 · Marathon
› SSC CGL Quant – Speed Rounds – Level 3 · Speed Round 3 · Tier I Challenge
Score: 0
Answered: 0 / 0
