

Mains Analysis: Poverty is now concentrated in the Gangetic belt – why India's next fight against poverty is about productive non-farm jobs
3 November 2026 · English Economy & Banking
⬇ Download this analysis as free PDF
இந்தப் பகுப்பாய்வைத் தமிழில் படிக்க →
Topics: Economy · GS-III · UPSC Mains Analysis
Context
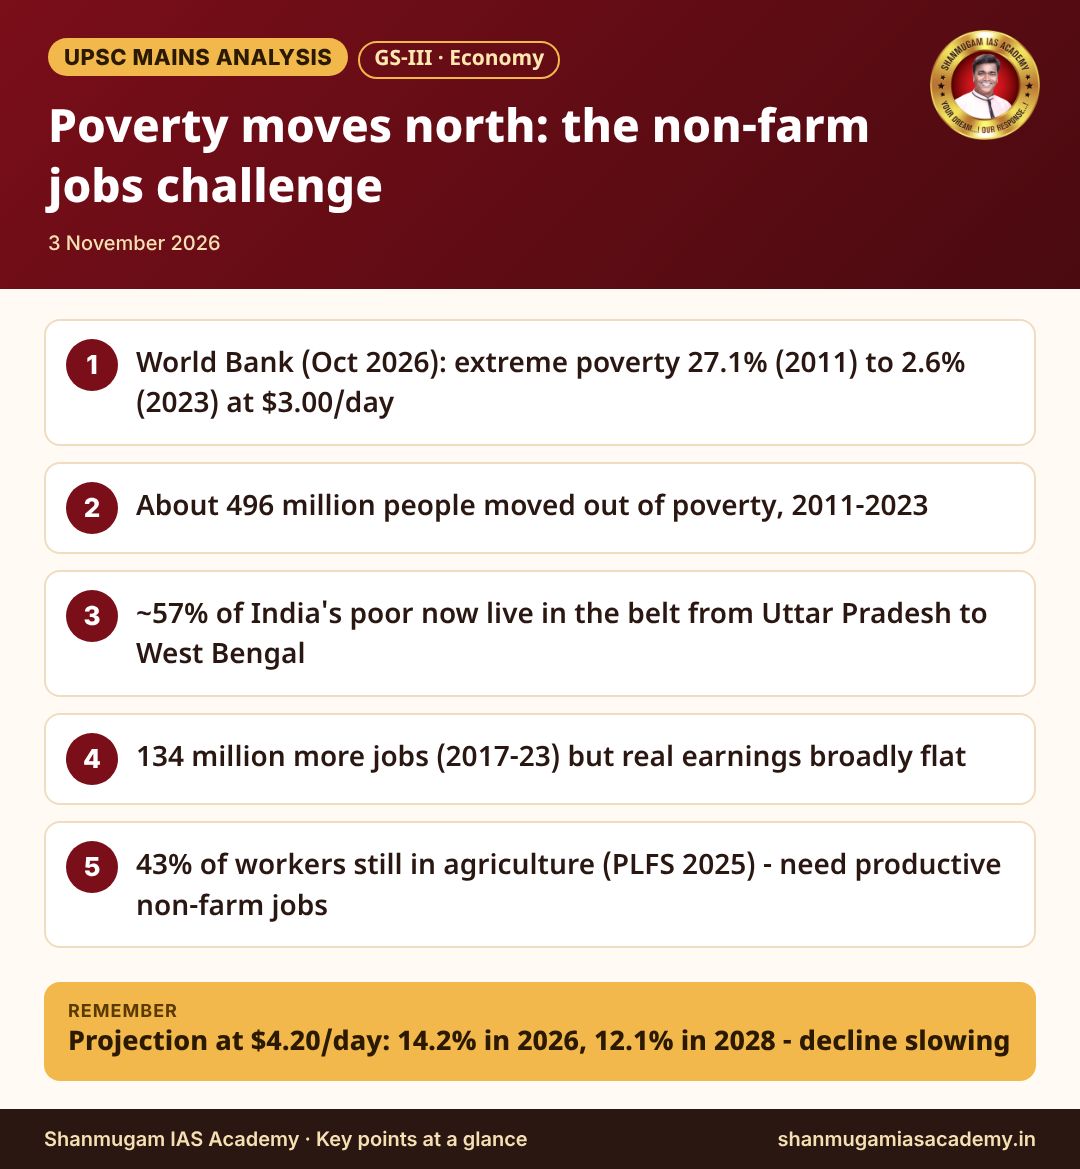
The World Bank's Poverty and Equity Brief for India (October 2026), reported on 30 October 2026, says India recorded "one of the fastest poverty declines" in the world. Extreme poverty – measured at the international line of US$3.00 a day (2021 PPP) – fell from 27.1% in 2011 to 2.6% in 2023. At the lower-middle-income line of US$4.20 a day, the poverty rate fell from 57.7% to 16.1%; the Bank estimates that about 496 million people moved out of poverty over 2011–2023. But the same brief adds two warnings. First, poverty is now geographically concentrated: about 57% of India's poor live in a contiguous belt running from Uttar Pradesh to West Bengal. Second, employment grew by about 134 million between 2017 and 2023, but real earnings stayed broadly flat and job growth was concentrated in low-productivity activities. The policy question has therefore changed – from "how to reduce poverty" to "how to create better jobs where the remaining poor live".
Background: how poverty is measured
| Measure | What it shows | Latest reading |
|---|---|---|
| World Bank international line – US$3.00/day (2021 PPP), adopted in June 2025 in place of US$2.15 (2017 PPP) | Extreme income/consumption poverty, comparable across countries | 27.1% (2011) to 2.6% (2023) |
| World Bank lower-middle-income line – US$4.20/day | A more relevant line for a lower-middle-income country such as India | 57.7% to 16.1%; projected 14.2% in 2026 and 12.1% in 2028 (indicative) |
| NITI Aayog National Multidimensional Poverty Index (12 indicators of health, education, living standards) | Deprivation, not income | 29.17% (2013-14) to 11.28% (2022-23); about 24.82 crore people moved out (NITI discussion paper, January 2024) |
| MoSPI Household Consumption Expenditure Survey (HCES) 2022-23 and 2023-24 | The base data for the World Bank estimates | Average monthly per capita consumption 2023-24: rural Rs 4,122, urban Rs 6,996; consumption inequality fell (rural 0.237, urban 0.284) |
The brief itself cautions that part of the recent fall may reflect better measurement (the new HCES design) as well as real gains. Students should therefore write "sharp fall, with a measurement caveat" – not "poverty has ended".
Why poverty is now a regional problem
- The numbers: roughly 57 of every 100 poor Indians live in the belt from Uttar Pradesh to West Bengal. In the April 2025 brief, five populous states – Uttar Pradesh, Maharashtra, Bihar, West Bengal and Madhya Pradesh – held 65% of India's extreme poor in 2011-12.
- Multidimensional data agree: NITI Aayog's 2023 index put the 2019-21 headcount at 33.76% in Bihar, 22.93% in Uttar Pradesh and 20.63% in Madhya Pradesh, against below 1% in Kerala and below 10% in all southern states.
- Why the gap persists: large farm workforces on small holdings, high dependency ratios, weaker urbanisation and few manufacturing clusters. The World Bank notes that poverty now clusters among households with lower education, fewer assets, limited access to stable employment and higher dependency ratios.
- The paradox: these same states recorded the largest absolute exits from poverty (Uttar Pradesh 5.94 crore and Bihar 3.77 crore in NITI's 2013-14 to 2022-23 estimate) – so progress is real, but the remaining poor are the hardest to reach.
Core analysis: the structural-transformation gap
| Dimension | Evidence | What it means |
|---|---|---|
| Farm dependence | Agriculture still employed about 43% of workers in 2025 (PLFS, calendar year 2025) | Too many workers share a sector that produces a much smaller share of output – low output per worker |
| Type of work | Self-employed 56.2%, regular wage/salaried 23.6%, casual labour 20.2% (PLFS 2025) | Most "jobs" are own-account or family work with irregular incomes |
| Quantity vs quality | 134 million more jobs (2017–2023), largely rural women entering paid work; real earnings broadly unchanged (World Bank) | More earners per household reduced poverty – but without higher productivity this route will flatten |
| Youth | Youth unemployment rose from 14.6% to 15.9% between Q1 FY26 and Q1 FY27, especially among rural young women (World Bank) | Educated young people want non-farm jobs that the lagging states do not yet offer |
| Firm size | Very many tiny firms and few medium ones – the "missing middle" | Small firms rarely grow, pay low wages and stay informal |
In development economics this is the Lewis model (W. Arthur Lewis, 1954): a country grows by moving surplus labour from low-productivity farming to a higher-productivity "modern" sector. India moved workers out of agriculture over decades, but mostly into construction and informal services rather than factories. Flat real earnings show that surplus labour has not yet been absorbed.
Policies in place
- Manufacturing push: Production Linked Incentive (PLI) schemes for 14 sectors (outlay about Rs 1.97 lakh crore) – largely capital- and technology-intensive, so job gains are modest relative to the need.
- Hiring incentive: Pradhan Mantri Viksit Bharat Rozgar Yojana (ELI scheme), approved on 1 July 2025 – outlay Rs 99,446 crore, target over 3.5 crore jobs created between 1 August 2025 and 31 July 2027, up to Rs 15,000 for first-time employees, special focus on manufacturing.
- Labour reform: the four Labour Codes (consolidating 29 central laws) came into force on 21 November 2025 – meant to simplify compliance and extend social security to gig and platform workers.
- Skills: Skill India / PMKVY 4.0 – short-term training; the persistent gap is placement and wages after training.
- Rural non-farm livelihoods: DAY-NRLM self-help groups; in his Independence Day address (15 August 2026) the Prime Minister raised the target for "Lakhpati Didis" (SHG members with household income of at least Rs 1 lakh a year) from 3 crore to 6 crore. Food processing (PMFME) and cluster schemes aim to add value near farms.
Challenges
- Location mismatch: new factories and services go to states with ports, power, skilled labour and urban infrastructure – mostly in the south and west – while the poor are in the east and north.
- Capital-intensive growth: incentive schemes favour electronics and high-tech sectors that create fewer jobs per rupee than garments, leather, footwear or food processing.
- Weak state capacity and urbanisation in the lagging states: land, power, logistics and ease of doing business.
- Women's work: much of the rise in female employment is unpaid or self-employed family work; care burdens and safety limit mobility.
- Migration as a substitute: workers migrate south and west for jobs, but portable welfare, housing and social security lag behind.
Way forward
- Place-based industrial policy: labour-intensive clusters (textiles, footwear, toys, food processing) in the Gangetic states, with plug-and-play industrial parks, assured power and logistics links to eastern ports.
- Grow the missing middle: credit guarantees, faster payments to MSMEs and simple, state-level adoption of the labour code rules so that small firms can grow and hire formally.
- Small towns as job hubs: invest in towns of 1–5 lakh people so that rural workers can take non-farm jobs without long migration.
- Skills linked to employers: apprenticeship-based training with placement and wage outcomes, not certificates alone.
- Raise farm productivity together: diversification to dairy, fisheries and horticulture, plus FPO-led value chains, frees labour and raises incomes.
- Measure what matters: track real earnings and productivity by state, not only headcount poverty.
Mains practice question
Answer framework: Introduction – World Bank October 2026 brief: extreme poverty 27.1% to 2.6% (2011–2023) · Body – (a) measurement: $3.00 and $4.20 lines, NITI MPI, HCES, with caveat; (b) regional concentration: 57% in the UP–West Bengal belt, MPI by state; (c) quality of jobs: 43% in agriculture, 56.2% self-employed, flat real earnings, youth unemployment; (d) policies: PLI, ELI, Labour Codes, Lakhpati Didi · Way forward – place-based industrial policy, missing middle, small towns · Conclusion – faculty-view line.
Prelims pointers
- World Bank international poverty line: US$3.00 a day (2021 PPP) since June 2025; lower-middle-income line US$4.20; upper-middle-income line US$8.30.
- NITI Aayog National MPI uses 12 indicators across health, education and standard of living (Alkire-Foster method, with UNDP and OPHI support).
- HCES 2023-24 (MoSPI): average MPCE rural Rs 4,122, urban Rs 6,996.
- PLFS Annual Report 2025 covers the calendar year (January–December 2025), released on 27 March 2026: unemployment rate (15+) 3.1%, LFPR 59.3%.
- Lakhpati Didi: an SHG member whose annual household income is at least Rs 1 lakh (DAY-NRLM).
The concept to carry into the exam hall is the "Lewis turning point" – the stage at which the surplus labour in farming is used up, so that employers must raise wages to attract workers. Flat real earnings and 43% of workers still in agriculture tell us India, and above all the Gangetic belt, has not reached it. Poverty headcounts can keep falling through transfers and more earners per family, but lasting prosperity comes only when wages start rising because labour has become scarce.
- A shift to note: poverty policy is becoming employment policy, and national policy is becoming state policy. Write: "the geography of poverty now decides the geography of industrial policy".
- What to watch next: (1) the outcome data of the ELI scheme by July 2027, (2) state rules under the Labour Codes in Uttar Pradesh, Bihar and West Bengal, (3) the next PLFS releases for real wages and the farm share, (4) whether the World Bank's 2028 projection of 12.1% at US$4.20 holds.
- Ready-made conclusion line: "India has pulled most of its people above the poverty line; the next task is to pull them out of low-productivity work – for the poor of the Gangetic belt, a good job is the best welfare scheme."
Sources: World Bank, Poverty and Equity Brief: India (October 2026), as reported by ANI/Republic, Outlook, Swarajya and The Pioneer (30 October 2026); World Bank brief of April 2025 (PIB, 26 April 2025); NITI Aayog National MPI 2023 (UNDP, All India Radio News) and discussion paper of January 2024 (PTI/The Week); MoSPI HCES 2023-24 (PIB factsheet, ETV Bharat); MoSPI PLFS Annual Report 2025 press note (PIB, 27 March 2026) and SBI Research; PIB on PLI schemes; PIB/Ministry of Labour on the ELI scheme; notifications on the Labour Codes (EY, DLA Piper); reports on Lakhpati Didi (YourStory, All India Radio News). Original analysis by Shanmugam IAS Academy.
Link to this page from your website / blog (HTML code)
BANK Achievers
-

ARUN VIGNESH
BANKING BANKING
TNPSC பொதுத்தமிழ் | 8th பழைய தமிழ் புத்தகம் | General Tamil MCQ | Group 4
TNPSC குரூப் 1, 2/2A, 4 – நேரடி வகுப்புகள் · கோவை & மதுரை
2006 முதல் சண்முகம் IAS அகாடமி · Classroom & online coaching in Coimbatore and Madurai
