

Mains Analysis: Why private investment lags – Centre and States
22 November 2026 · English Infrastructure & Energy
⬇ Download this analysis as free PDF
Topics: Indian Economy – Growth, Investment Models, Infrastructure, Ease of Doing Business · GS-III · UPSC Mains Analysis
Key takeaways
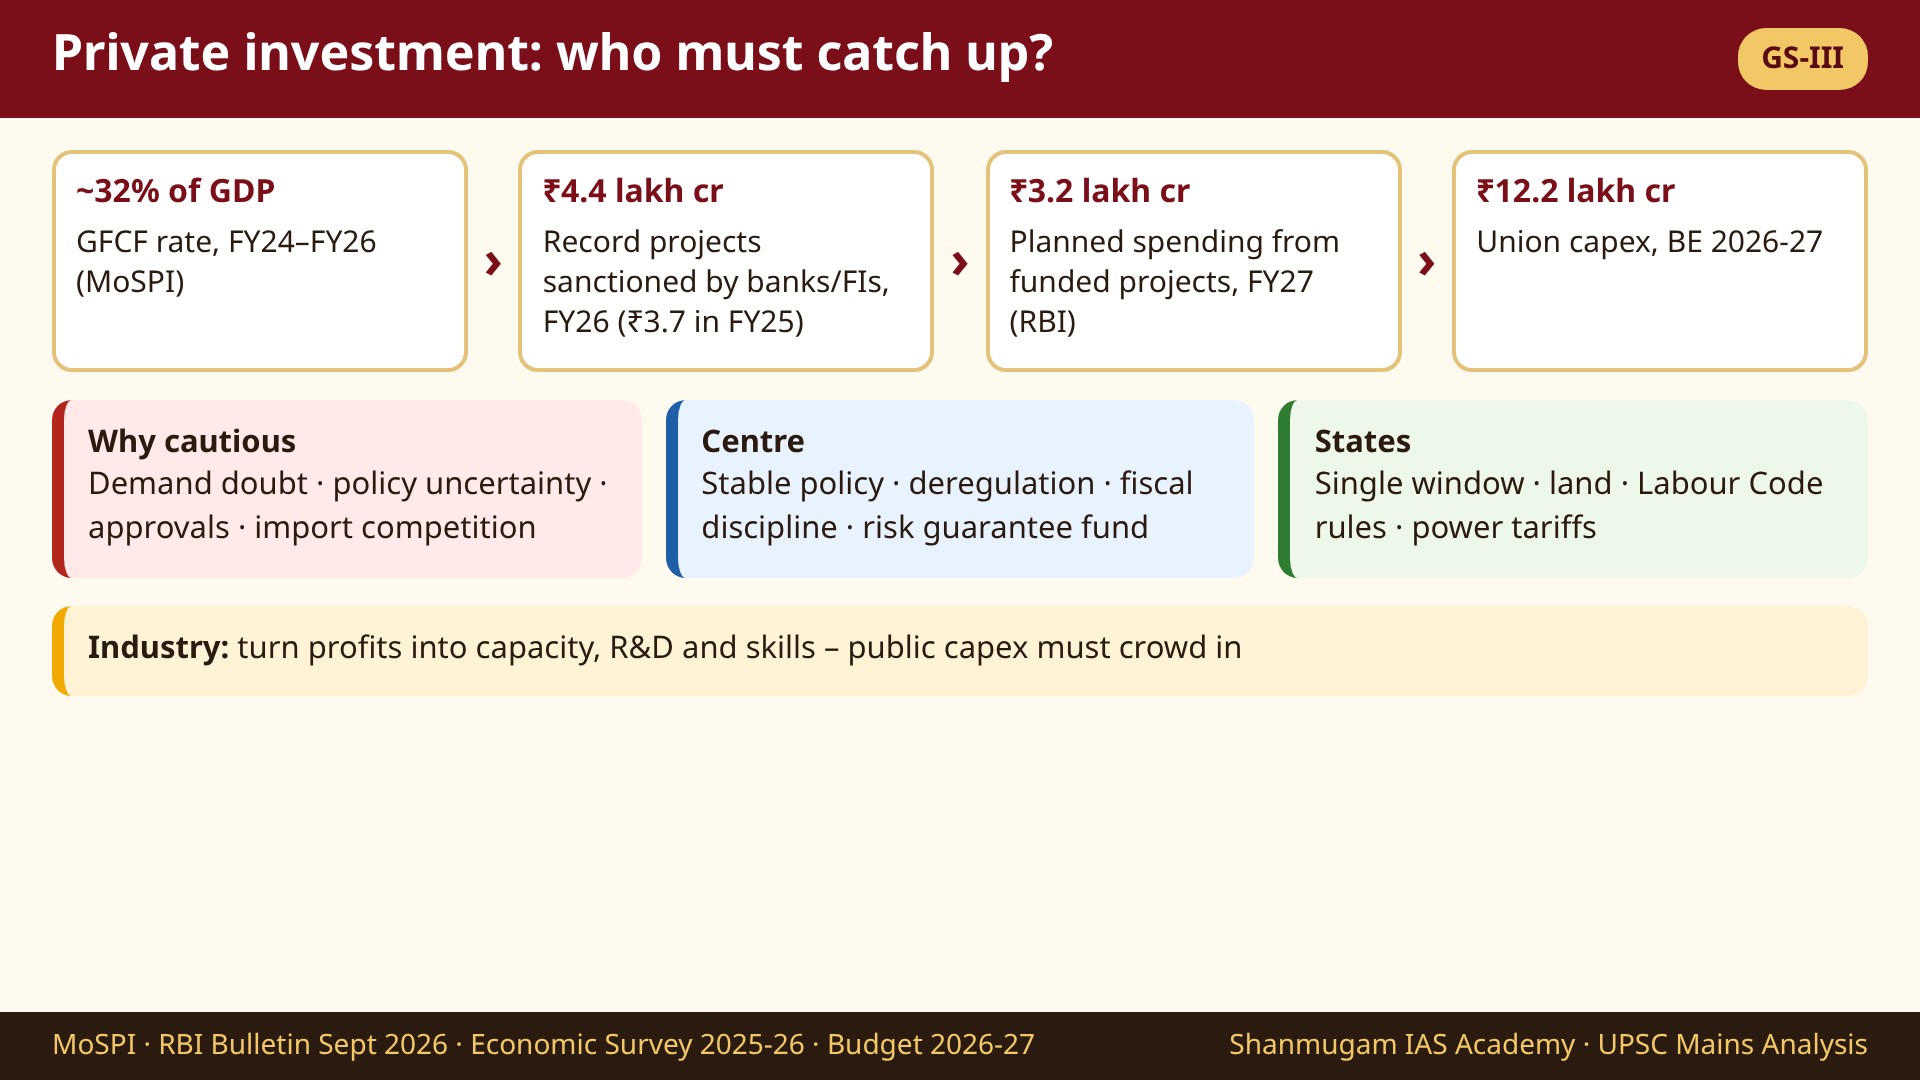
- India grew 7.7% in 2025-26 and 7.8% in Q1 2026-27 (MoSPI), but private investment has trailed public capex: the GFCF rate stayed near 32% of GDP for three years before rising to 34.3% in Q1 2026-27.
- Banks and FIs sanctioned a record ₹4.4 lakh crore of projects in 2025-26 (₹3.7 lakh crore in 2024-25), yet the capex firms plan to actually spend in 2026-27 from funded projects is ₹3.2 lakh crore (RBI) – turning plans into execution is the real lag; Union capex is ₹12.2 lakh crore (BE 2026-27).
- Causes: demand doubt, policy uncertainty, State-level approvals, import competition. Remedies: stable policy, deregulation with States, quality public capex that crowds in, risk sharing – and industry turning profits into capacity. PYQ: Prelims 2018 (capital-output ratio).

Why in news
India is growing fast – 7.7% in 2025-26 and 7.8% in April–June 2026 (MoSPI) – and investment picked up sharply in the first quarter of 2026-27. Yet the long-standing worry remains: private firms are not investing at the pace the economy needs, and much of the lifting has been done by public capital spending. Commentators have argued that both governments (Centre and States) and industry must "catch up" – governments by deregulating and giving policy certainty, industry by turning profits and announcements into new capacity.
What the official data show
| Indicator | Figure | Source |
|---|---|---|
| Real GDP growth | 7.7% (2025-26 PE); 7.8% (Q1 2026-27) | MoSPI, 5 June and 31 August 2026 (base 2022-23) |
| Real GFCF growth | 8.2% (2025-26); 11.9% (Q1 2026-27) | MoSPI |
| GFCF as % of GDP (current prices) | 31.9% (2023-24) · 31.6% (2024-25) · 31.9% (2025-26); 34.3% in Q1 2026-27 vs 31.4% a year earlier | MoSPI |
| Private capex (projects in the pipeline) | ₹3.2 lakh crore expected in 2026-27 vs ₹2.6 lakh crore in 2025-26 | RBI Bulletin, September 2026 (banks/FIs, ECBs, IPOs) |
| Projects sanctioned by banks and FIs | Record ₹4.4 lakh crore in 2025-26 (₹3.7 lakh crore in 2024-25); infrastructure 54.2% | RBI Bulletin, September 2026 |
| Union capital expenditure | ₹12.2 lakh crore (BE 2026-27), up from ₹11.2 lakh crore (BE 2025-26) | Union Budget 2026-27 |
Reading the numbers: the investment rate has stayed around 31–32% of GDP for three years and jumped only in the latest quarter. Banks and FIs sanctioned a record ₹4.4 lakh crore of projects in 2025-26 (total cost, spread over several years), but the capex that firms actually plan to spend in a year from funded projects – ₹3.2 lakh crore in 2026-27, a partial measure covering bank/FI, ECB and IPO funding – is much smaller and is concentrated in power, roads and a few other sectors. Turning plans into execution is the real "lag".
Why private investment is cautious
| Factor | How it holds back investment |
|---|---|
| Demand doubt | Firms add capacity only when they are sure of sales; uneven consumption and uncertain exports (tariff shocks, global slowdown) delay decisions |
| Policy uncertainty | Sudden changes in tariffs, taxes or rules raise the risk premium; long projects need stable rules for 10–20 years |
| Regulatory cholesterol | Many approvals – land, environment, building, fire, labour – sit with States and local bodies; criminal penalties for minor lapses add fear |
| Cost of doing business | Land acquisition delays, power tariffs that cross-subsidise others, logistics costs, slow contract enforcement |
| Import competition | Cheap imports from countries with excess capacity hit margins in steel, chemicals, solar and electronics |
| Corporate choices | Healthy balance sheets can be used to repay debt, buy back shares or acquire firms instead of building new (greenfield) plants |
What has already been done
- Public capex push: the Centre's capex rose from about ₹3.4 lakh crore (FY20) to ₹10.5 lakh crore (FY25); States kept capex around 2.4% of GDP with interest-free 50-year loans under SASCI (Economic Survey 2025-26).
- Tax and compliance: GST rate rationalisation from 22 September 2025; the Jan Vishwas (Amendment of Provisions) Bill, 2026, passed by Parliament on 1–2 April 2026, covers 784 provisions in 79 Central Acts, decriminalising 717.
- Labour: the four Labour Codes, consolidating 29 central laws, came into force on 21 November 2025.
- Budget 2026-27: an Infrastructure Risk Guarantee Fund to give private developers comfort during construction; High-Level Committees on regulatory reform; the Centre working with States on deregulation – over 350 reforms rolled out since August 2025.
What Centre and States must still do
| Centre | States |
|---|---|
| Keep policy stable and predictable – announce tariff and tax changes with clear timelines; avoid retrospective moves | Single-window approvals that actually work, with deemed approval after a fixed time |
| Finish deregulation – move from decriminalising Central laws to trust-based, risk-based inspection | Reform land records and land-use change; build ready land banks and plug-and-play industrial parks |
| Keep fiscal discipline (deficit 4.3% of GDP in BE 2026-27) so that interest rates fall and capex crowds in | Notify and implement Labour Code rules; rationalise power tariffs for industry |
| Faster contract enforcement and dispute resolution (commercial courts, arbitration) | Compete for investment on governance, not only on subsidies |
And industry? With profits and cleaner balance sheets, firms must invest in capacity, R&D and skills – not wait for subsidies alone. India's R&D spending, much of it by the government, remains low by global standards.
Static syllabus link
- GS-III: Indian economy and issues of planning, mobilisation of resources, growth and investment; investment models (PPP, HAM, EPC); infrastructure; effects of liberalisation and changes in industrial policy.
- Concepts: GFCF vs gross capital formation; crowding in / crowding out; incremental capital-output ratio (ICOR); savings–investment gap; animal spirits.
- GS-II link: cooperative and competitive federalism – most business approvals are with States.
Tamil Nadu angle
- In the RBI's analysis of projects sanctioned in 2025-26, Tamil Nadu was among the top six States by share of project cost (with Maharashtra, Gujarat, Rajasthan, Karnataka and Andhra Pradesh; together 67.1%).
- The State's strengths – a wide manufacturing base, skilled workforce, ports and investment-promotion agency Guidance Tamil Nadu – show what States can do; the test is converting MoUs signed at investor meets into factories and jobs.
Faculty view
Do not write "private investment is low" without numbers. Use three: the GFCF rate (about 32% of GDP), the RBI pipeline (₹3.2 lakh crore for 2026-27) and the Union capex (₹12.2 lakh crore). Then explain the plan–execution gap and divide the remedy into Centre, States and industry. Link to the crowding-in idea and the 2018 PYQ on the capital-output ratio – it shows you understand that investment must also be efficient.
Way forward
- Certainty first: a stable, published policy calendar for tariffs, taxes and incentives.
- Deregulation 2.0: risk-based inspection, self-certification, deemed approvals – with States as full partners.
- Quality public capex: projects that remove logistics and power bottlenecks crowd in private money best.
- Risk sharing: make the Infrastructure Risk Guarantee Fund and PPP models work, with fair contracts and quick dispute resolution.
- Industry's part: invest in capacity, technology and skills; build global-scale firms.
Glossary – Crowding in
The idea that public investment can pull in (crowd in) private investment instead of pushing it out. When the government builds roads, ports, power lines and logistics, it lowers costs and risks for private firms and raises the return on their own projects, so they invest more. The opposite, crowding out, happens when heavy government borrowing raises interest rates and takes away savings that private firms need. Whether public capex crowds in depends on its quality (projects that remove real bottlenecks), on fiscal discipline (so that rates do not rise) and on policy certainty. India's strategy since 2020 – high public capex, with the Centre's effective capital spending rising from about 2.6% to 4.0% of GDP between FY20 and FY25 (Economic Survey 2025-26) – is a bet on crowding in.
Asked before in UPSC
1. "Despite being a high saving economy, capital formation may not result in significant increase in output due to (a) weak administrative machinery (b) illiteracy (c) high population density (d) high capital-output ratio" – Prelims 2018 (answer: high capital-output ratio).
2. "Which among the following steps is most likely to be taken at the time of an economic recession?" – Prelims 2021 (answer: increase in expenditure on public projects) – the logic of counter-cyclical public capex.
3. Mains GS-III regularly asks about growth, investment and infrastructure financing; this topic fits those themes.
Mains practice question
"High public capital expenditure has kept India's investment rate up, but a durable revival needs private investment." Discuss the reasons for the slow private investment response and suggest measures for the Centre and the States. (15 marks, 250 words)
FAQ
What is India's investment rate?
Gross fixed capital formation was 31.9% of GDP in 2025-26 at current prices (MoSPI, base 2022-23) and 34.3% in April–June 2026.
How much private capex is expected in 2026-27?
About ₹3.2 lakh crore, up from ₹2.6 lakh crore in 2025-26, based on projects financed by banks and financial institutions, ECBs and IPOs (RBI Bulletin, September 2026).
What is crowding in?
When public investment in infrastructure lowers costs and risks for private firms and so encourages them to invest more.
What is the Infrastructure Risk Guarantee Fund?
A fund announced in the Union Budget 2026-27 to strengthen private developers' confidence by sharing risks during the construction phase.
Why do States matter for private investment?
Land, building, environment, power and many labour approvals are handled by States and local bodies, so deregulation and single-window systems at State level decide how fast projects start.
Sources: MoSPI press notes on GDP – Provisional Estimates 2025-26 (5 June 2026) and Q1 2026-27 (31 August 2026); Economic Survey 2025-26, chapter 1; Union Budget 2026-27 speech; RBI Bulletin, September 2026 (as reported by ANI and Business Standard, 25–27 September 2026); Lok Sabha and Rajya Sabha proceedings on the Jan Vishwas (Amendment of Provisions) Bill, 2026 (All India Radio News, 2 April 2026); Ministry of Labour and Employment (Labour Codes, 21 November 2025). Analysis is our own.
Related on our site: UPSC Mains Analysis – all articles · UPSC glossary · UPSC Mains answer-writing practice · Free PDF downloads
Add us as a preferred source on Google
Link to this page from your website / blog (HTML code)
TET Achievers
-

A. UMADEVI
TET TET
Today Current Affairs in Tamil | 23 நவம்பர் 2026 | TNPSC Group 4 முக்கிய வினாக்கள்
📚 TNPSC குரூப் 4 / 2 / 2A – பொதுத்தமிழ், பொது அறிவு நூல்கள்
PDF நூல்கள் · ₹149 முதல் · ஒவ்வொன்றுக்கும் 50 பக்க இலவச மாதிரி · UPI-இல் பணம் செலுத்தியதும் உடனே பதிவிறக்கம்
 பொதுத் தமிழ் — முழுமையான கையேடு (TNPSC குரூப் 2 · 2A · 4)
₹199
 TNPSC முழுமையான பாடநூல்கள் – முழுத் தொகுப்பு (9 நூல்கள்)
₹1599
 பொதுத் தமிழ் — முந்தைய ஆண்டு வினா – விடை – விளக்கம் (புதிய பாடத்திட்டம்)
₹199
 TNPSC திறனறிவும் மனக்கணக்கு நுண்ணறிவும் (Aptitude & Mental Ability) – முழுமையான பாடநூல்
₹199
TNPSC குரூப் 1, 2/2A, 4 – நேரடி வகுப்புகள் · கோவை & மதுரை
2006 முதல் சண்முகம் IAS அகாடமி · Classroom & online coaching in Coimbatore and Madurai
